HTTP
HTTP Protocol Access allows devices that do not natively support MQTT to exchange data with ThingsPanel through standard HTTP requests. Devices report telemetry to the HTTP adapter; ThingsPanel sends commands or control messages through MQTT; the adapter supports both direct HTTP downlink and device long polling.
Repository
ThingsPanel/thingspanel-adapter-http
Prerequisites
Install ThingsPanel Community Edition using the official installer (HTTP device access service is included), or deploy from source. If deploying from source, register the HTTP Protocol Access Plugin in the System Administrator panel before use.
Port Responsibilities
| Port | Owner | Purpose |
|---|---|---|
19090 | HTTP adapter | Device-facing API: uplink, poll, ack |
19091 | HTTP adapter | Platform callback and health endpoints |
8080 | Device side | Default direct downlink receiver port for /api/v1/control and /api/v1/command |
Device uplink, long polling, and ack requests use 19090. Platform callbacks use 19091.
Device Identity
Devices identify themselves with device_number, for example D001. The platform's internal device_id is assigned by ThingsPanel and is resolved by the adapter after querying device configuration. Device payloads and long-poll URLs should use device_number, not device_id.
Operation Flowchart
Onboarding Steps
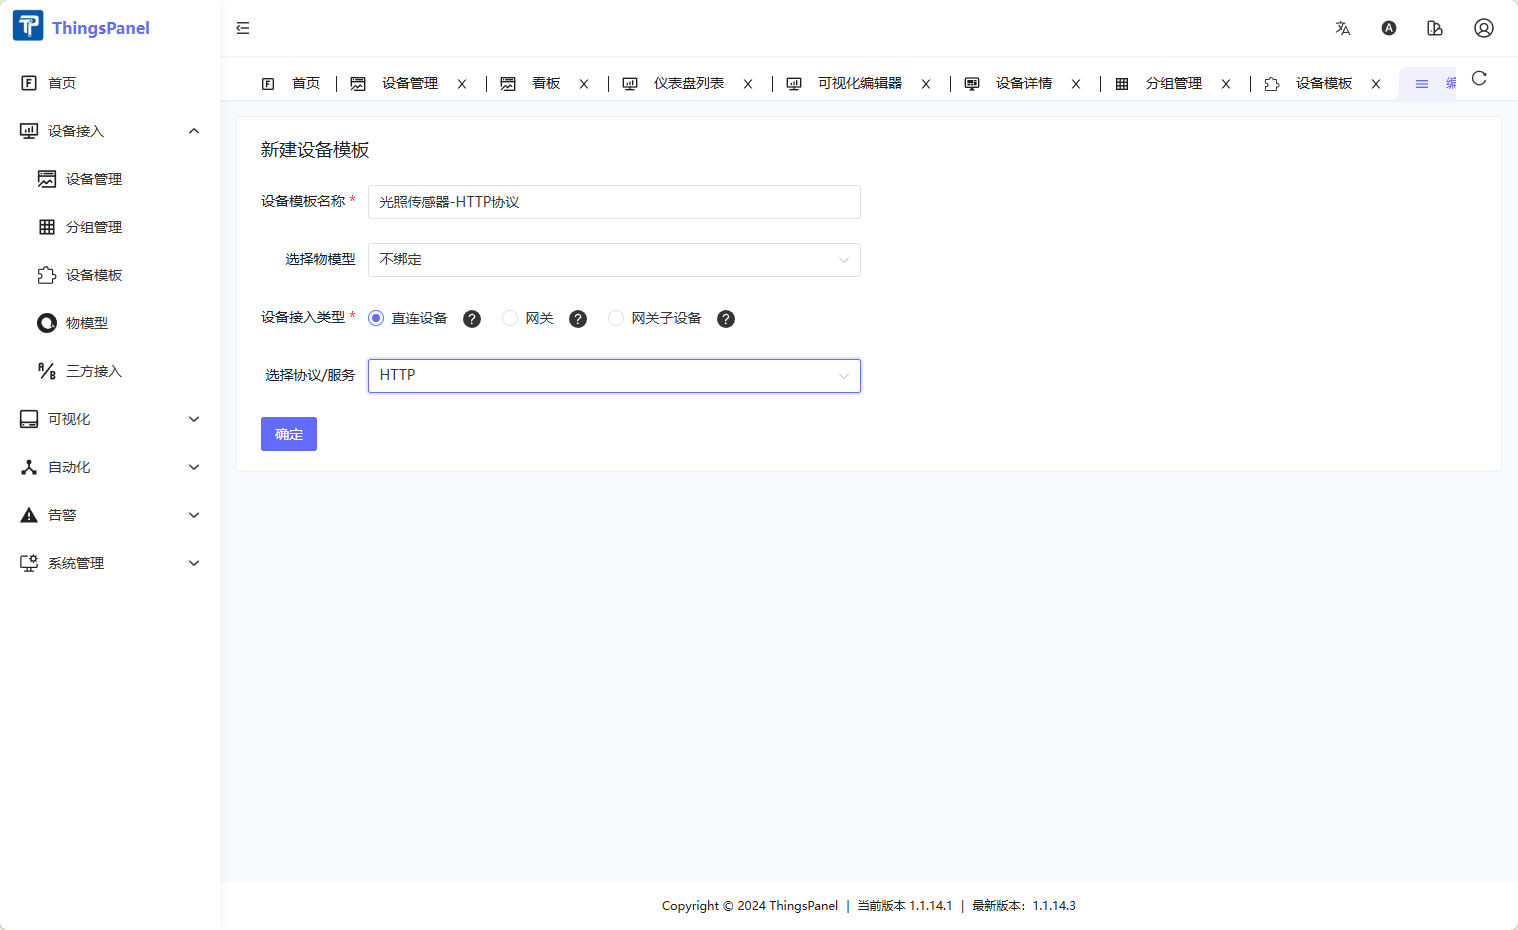
Create Device Template
- Log in to ThingsPanel as a tenant.
- Go to Device Connectivity -> Device Template, click Create Template, select Direct Device -> HTTP Protocol, then save.
Create Device
- Go to Device Connectivity -> Device Management, click Add Device, select the HTTP Protocol template created above.
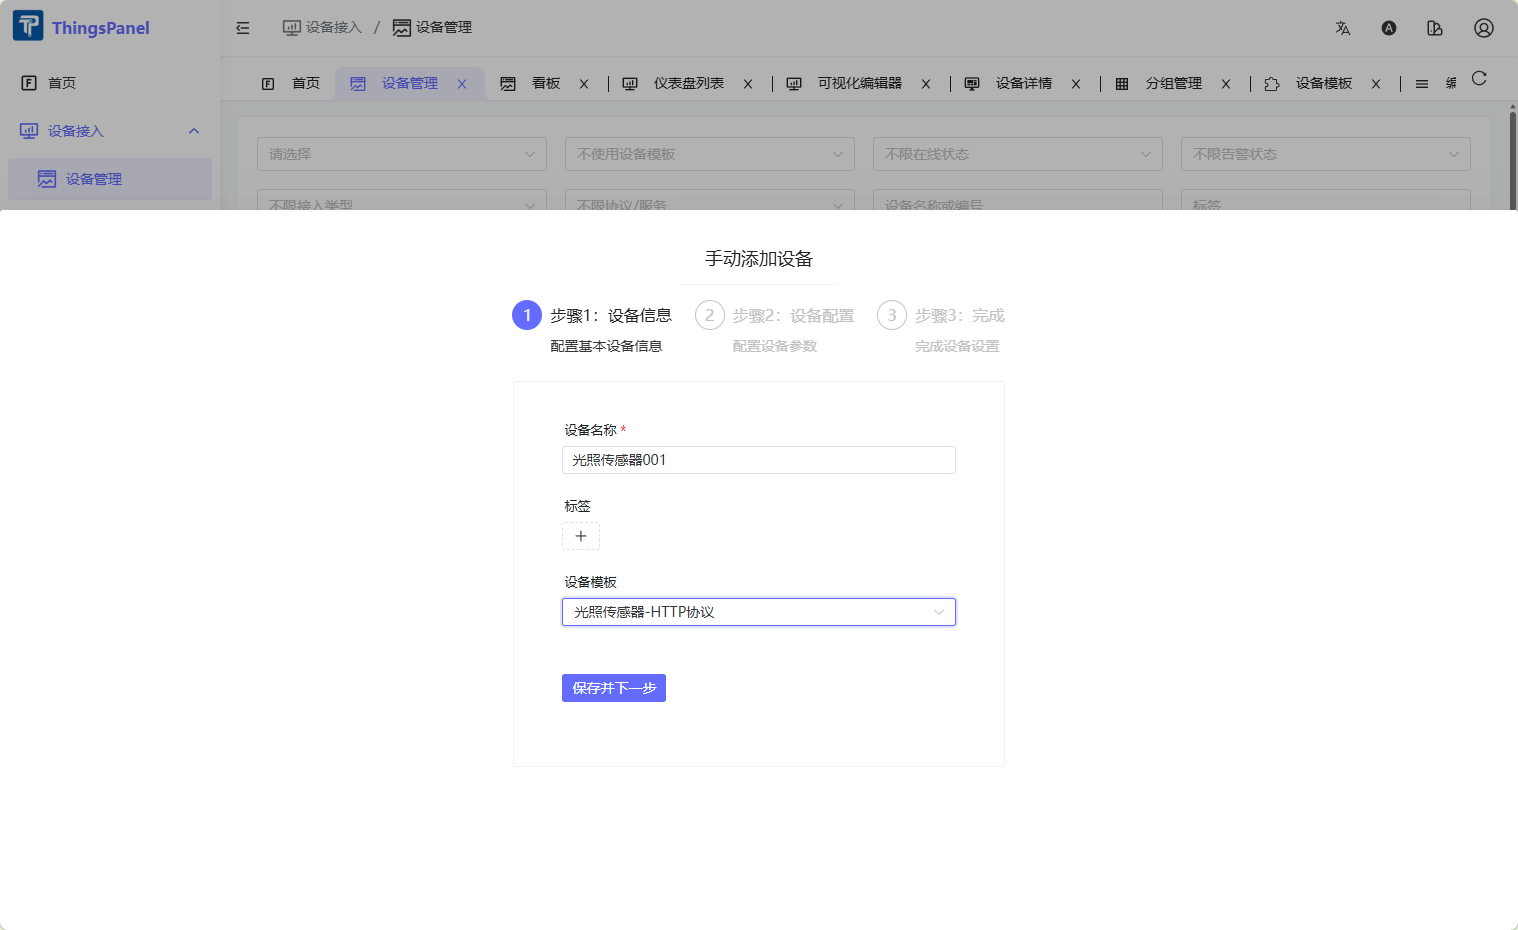
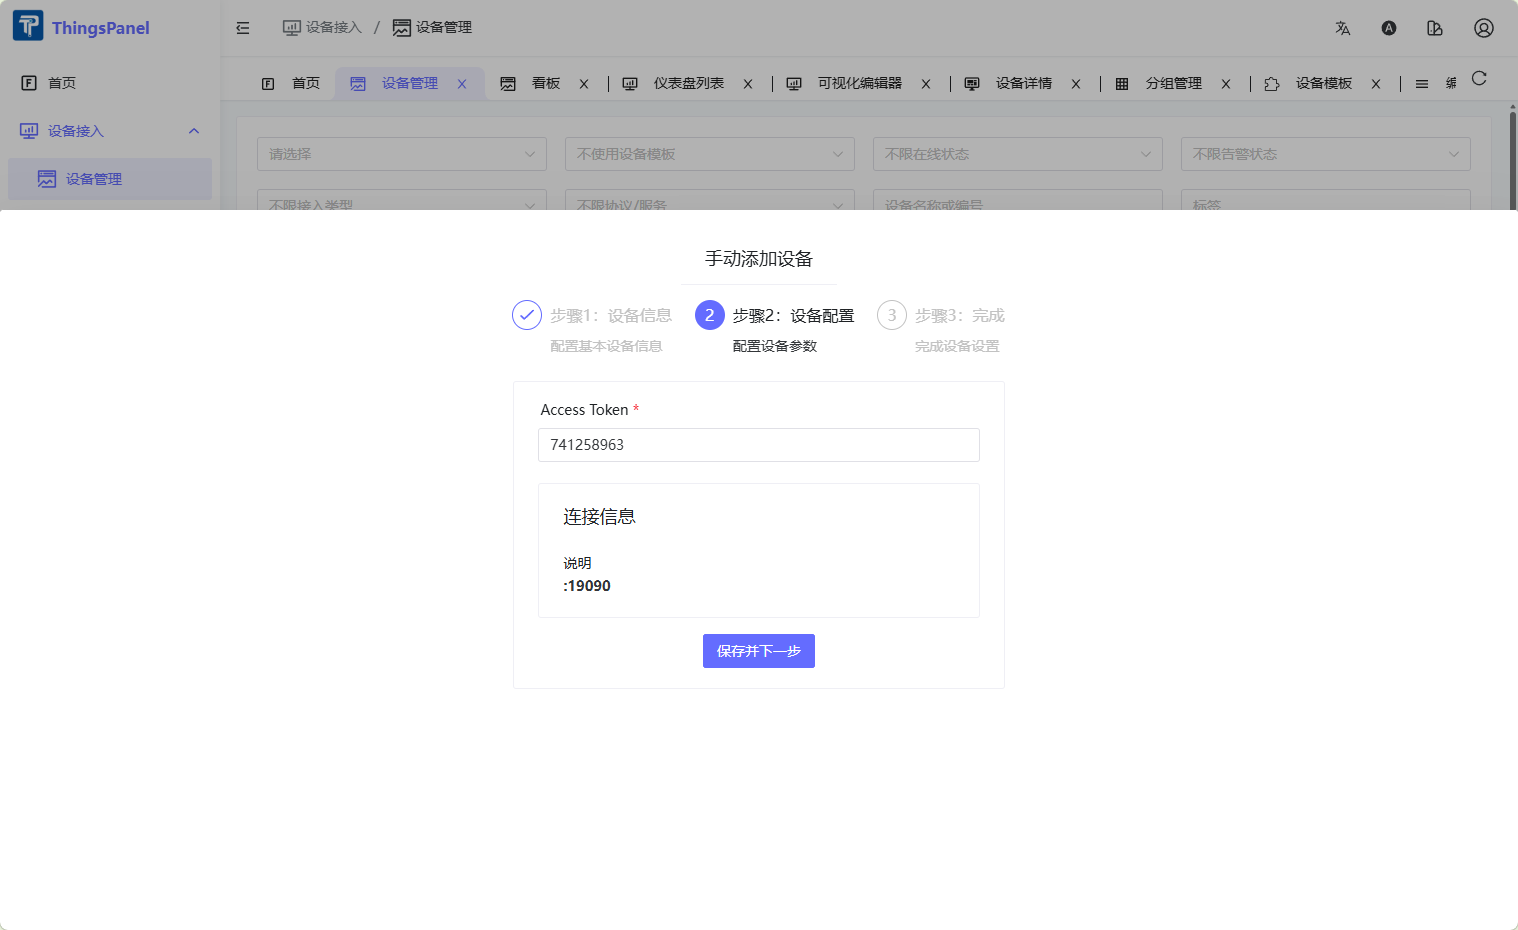
- Fill in the Access Token (must be unique per device) and save.
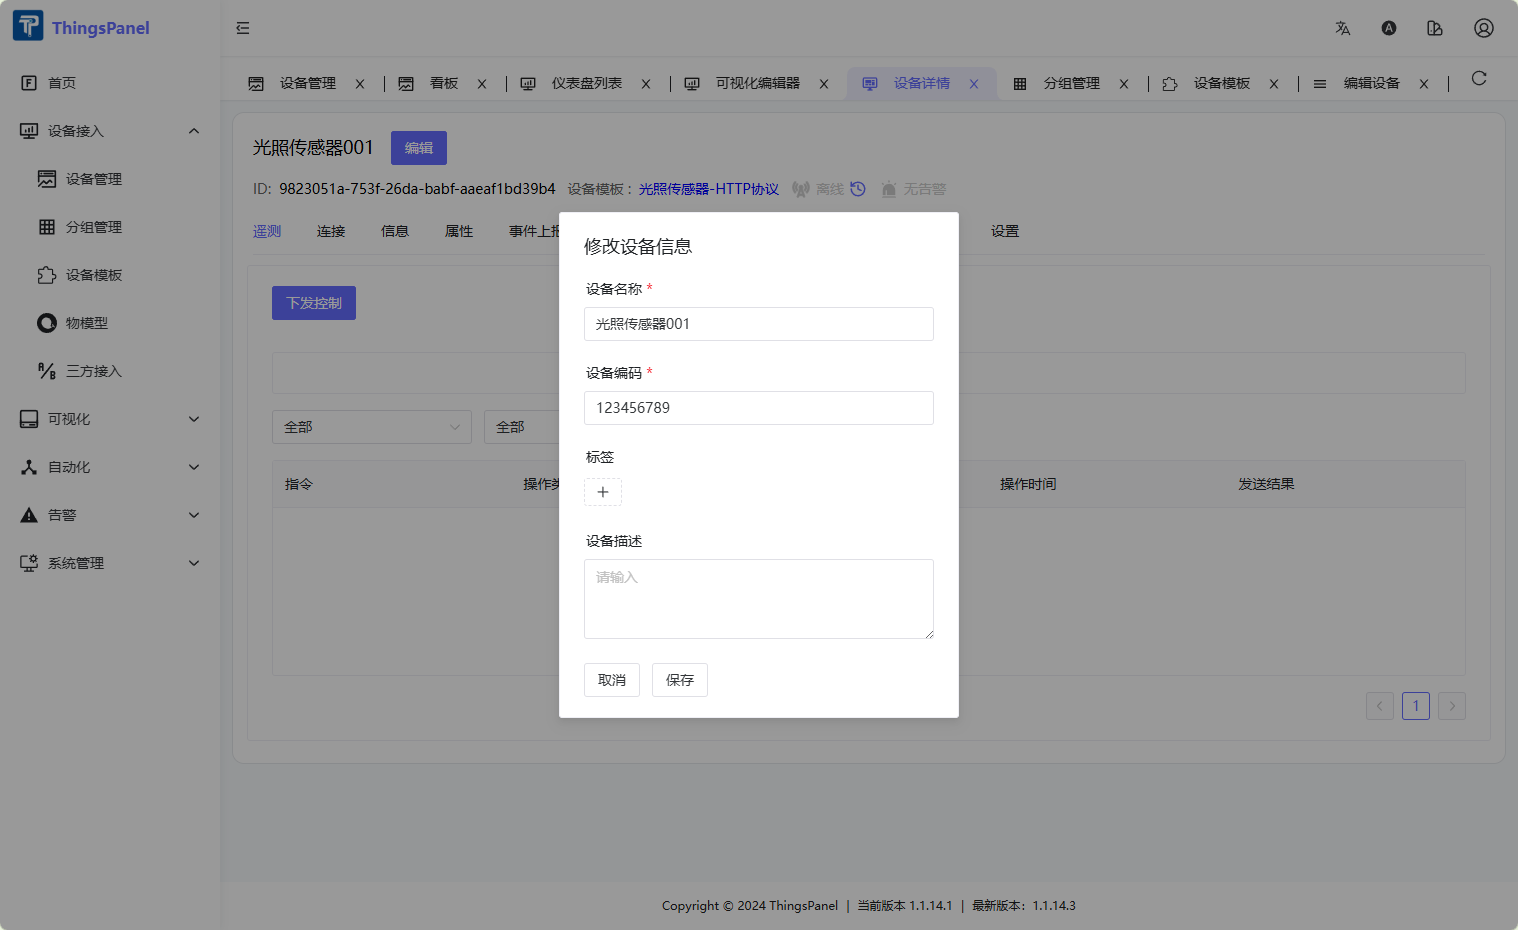
- Click the Edit button on the device card to open device details. Locate and record the Device Number. This is the unique identifier used in HTTP payloads, long-poll URLs, and control topics.
Send Telemetry Data
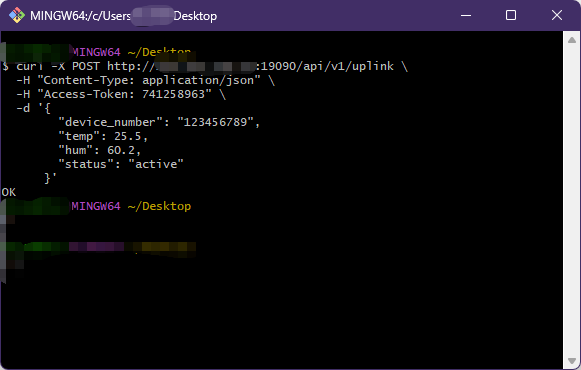
Devices send data via HTTP POST to the adapter uplink endpoint. Replace YOUR_ACCESS_TOKEN and YOUR_DEVICE_NUMBER with values from your device.
curl -X POST http://127.0.0.1:19090/api/v1/uplink \
  -H "Content-Type: application/json" \
  -H "Access-Token: YOUR_ACCESS_TOKEN" \
  -d '{
        "device_number": "YOUR_DEVICE_NUMBER",
        "temp": 25.5,
        "hum": 60.2,
        "status": "active"
      }'
| Field | Description |
|---|---|
Access-Token header | Device access token configured on the platform |
device_number in body | Device number assigned by the platform, for example D001 |
| JSON body | Arbitrary telemetry key-value pairs |
Downlink Modes
Direct Mode
Use direct mode when the device or middleware has a public/reachable HTTP endpoint.
Set optional downlinkHost in the device voucher. The adapter posts directly to:
POST http://downlinkHost:8080/api/v1/control
POST http://downlinkHost:8080/api/v1/command
Control request body:
{
  "tp_device_number": "D001",
  "values": {
    "xx": 11
  }
}
Command request body:
{
  "tp_message_id": "msg-001",
  "tp_device_id": "platform-device-id",
  "tp_device_number": "D001",
  "method": "set",
  "params": {}
}
The device must expose an HTTP server for the configured downlink paths. A client that only reports telemetry will not receive direct control commands.
Long Polling Mode
Use long polling when the device is behind NAT or otherwise not reachable by the adapter.
If downlinkHost is empty, downlink messages are queued for the device to fetch. If direct mode is configured but the direct request fails, the adapter also falls back to the long-poll queue.
GET http://adapter-host:19090/api/v1/devices/{device_number}/poll
The poll request waits up to 30 seconds.
No pending message:
{
  "commands": []
}
Pending command:
{
  "commands": [
    {
      "type": "command",
      "device_number": "D001",
      "message_id": "msg-001",
      "method": "set",
      "params": {}
    }
  ]
}
After executing a command from poll, the device reports the result:
POST http://adapter-host:19090/api/v1/devices/{device_number}/commands/{message_id}/ack
{
  "ok": true,
  "data": {}
}
Authentication uses the device accessToken from the voucher. Send it as X-Api-Key, Access-Token, or Authorization: Bearer <token>.
Platform Control Topic
The platform sends HTTP device control messages through the plugin MQTT topic:
plugin/HTTP/devices/telemetry/control/<device_number>
Example:
plugin/HTTP/devices/telemetry/control/D001
Payload:
{
  "xx": 11
}
Form Configuration
The plugin returns two groups of device configuration fields to the frontend:
| Group | Field | Description |
|---|---|---|
| CFG | port | Direct device downlink port, default 8080. |
| CFG | controlUrl | Device control path, default /api/v1/control. |
| CFG | commandUrl | Device command path, default /api/v1/command. |
| VCR | accessToken | Device credential used for uplink, poll, and ack authentication. |
| VCR | downlinkHost | Optional direct downlink host. Leave empty for long polling mode. |
Virtual Device Test
Long polling test:
go run .\cmd\virtual_device -server http://127.0.0.1:19090/api/v1/uplink -device D001 -token YOUR_ACCESS_TOKEN
Direct downlink test:
go run .\cmd\virtual_device -server http://127.0.0.1:19090/api/v1/uplink -device D001 -token YOUR_ACCESS_TOKEN -poll=false -listen :8080
For direct mode, set the device voucher downlinkHost to 127.0.0.1 and keep the default port 8080.
View Telemetry Data
After the device successfully reports data, it appears online. You can view real-time telemetry on the device detail page.
Common Issues
- Device not found: Confirm the ThingsPanel device exists and its device number matches the
device_numberin payloads and URLs. - SDK log shows empty
deviceIDwhile querying: Device uplink queries configuration bydevice_number. The SDK log only printsdeviceID, so an empty value there does not mean the adapter useddevice_id. - No response when reporting data: Verify that the
Access Tokenmatches the platform configuration, and that the device network can reach the adapter uplink port19090. - Adapter not started: Confirm the device uplink port
19090is not already in use (Linux:netstat -tulpn | grep 19090). - Platform connection failed: Confirm
platform.urlinconfigs/config.yamlis reachable from the adapter host, and that the configured MQTT broker is running. - Direct downlink connection refused: Confirm the device has an HTTP server listening on
downlinkHost:port/controlUrlorcommandUrl. - Long polling keeps returning an empty queue: Confirm the platform sent the downlink to the expected
device_number, and thatdownlinkHostis empty or direct mode failed and fell back to polling.